Dashboards
syncc admin includes two dashboards, each designed for a different audience and time horizon:
| Dashboard | Route | Purpose | Audience |
|---|---|---|---|
| Tablero de Control | /dashboard |
Real-time compliance monitoring | Municipality regulators, supervisors |
| Dashboard de Operaciones | /dashboard-v1 |
Historical operations analytics | Fleet managers, sindicato admins |
Tablero de Control — Cumplimiento en Tiempo Real
Route:
/dashboard
Refresh: automatic every 10 minutes (matches the Prom. 1h bucket cadence)
This dashboard answers the question: "Right now, is each route running the number of vehicles the schedule requires?"
It compares live GPS activity against the trip schedules on file and assigns each route a compliance status.
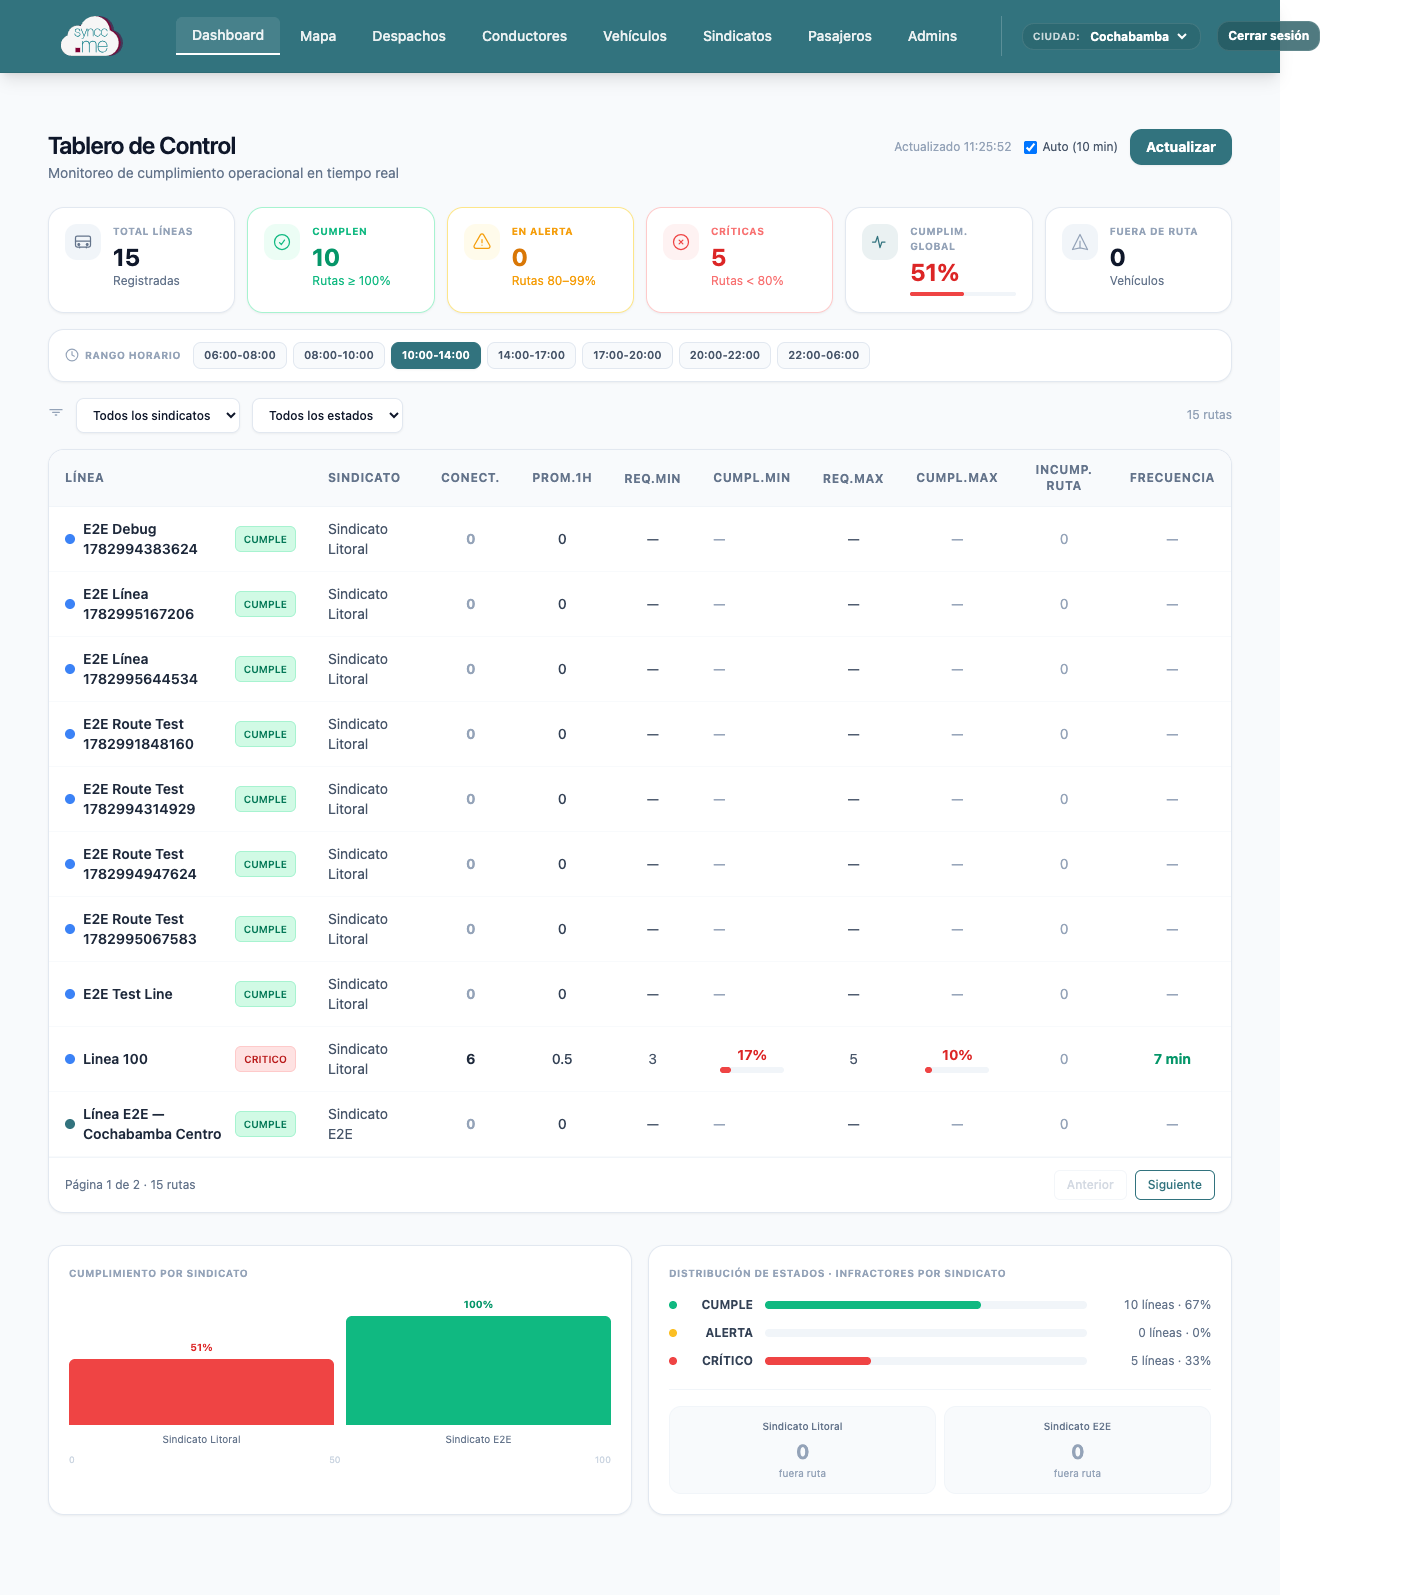
KPI Cards (top row)
| Card | What it shows |
|---|---|
| Total Líneas | Number of registered lines in the system (or scoped to the user's sindicato) |
| Cumplen | Lines whose compliance is ≥ 100% of the minimum vehicle requirement |
| En Alerta | Lines between 80 % and 99 % of minimum requirement |
| Críticas | Lines below 80 % of minimum requirement |
| Cumplim. Global | Weighted average of CUMPL.MIN across all lines that have a schedule (lines with no schedule are excluded) |
| Fuera de Ruta | Count of active vehicles whose last GPS ping is not within the radius of any checkpoint on their line |
Rango Horario (Time-Slot Filter)
Seven fixed windows cover the operating day. Clicking one re-fetches all data filtered to that window.
| Slot | Typical pattern |
|---|---|
| 06:00–08:00 | Morning ramp-up |
| 08:00–10:00 | Peak AM |
| 10:00–14:00 | Mid-morning to early afternoon |
| 14:00–17:00 | Midday |
| 17:00–20:00 | Peak PM |
| 20:00–22:00 | Evening wind-down |
| 22:00–06:00 | Overnight (wraps midnight) |
The selected slot controls which TripSchedule records are used to compute REQ.MIN and REQ.MAX for each line.
Compliance Table — Column Reference
| Column | Meaning |
|---|---|
| LÍNEA | Route name and color dot. The badge (CUMPLE / ALERTA / CRÍTICO) is determined by CUMPL.MIN. |
| SINDICATO | The transport union (tenant) that operates the line. |
| CONECT. | Number of trips with status ACTIVE right now on that line. This is the instantaneous vehicle count. |
| PROM.1H | Average vehicles seen on this line over the last 60 minutes, computed using 6 ten-minute buckets. Each bucket counts distinct vehicles that sent a GPS ping in that 10-minute window; the six bucket counts are averaged. A vehicle active for 20 of 60 minutes contributes ~0.33 to the average, not 1. |
| REQ.MIN | Minimum number of vehicles the schedule requires during the selected time slot. Derived from TripSchedule: the backend groups schedule entries by hour within the slot, counts entries per hour, and takes the minimum across hours. Represents the off-peak requirement. |
| CUMPL.MIN | PROM.1H / REQ.MIN × 100, capped at 200 %. The colored progress bar uses the same thresholds as the status badge. A line with no schedule has REQ.MIN = 0 and is always CUMPLE. |
| REQ.MAX | Maximum vehicles required during the selected slot (peak-hour count). Always ≥ REQ.MIN. |
| CUMPL.MAX | PROM.1H / REQ.MAX × 100, capped at 200 %. Shows how well the line covers peak demand. Always ≤ CUMPL.MIN because the denominator is larger. |
| INCUMP. RUTA | Number of active vehicles on this line currently detected as off-route (latest GPS position is outside the radius of every checkpoint). |
| FRECUENCIA | Average gap in minutes between consecutive vehicle arrivals at the same checkpoint across all checkpoints on the line. Computed from the actualCheckpoints JSON on active trips. Color: green ≤ 10 min, amber 11–20 min, red > 20 min, grey = insufficient data. |
Status thresholds
| Status | CUMPL.MIN | Badge color |
|---|---|---|
| CUMPLE | ≥ 100 % | Green |
| ALERTA | 80 – 99 % | Amber |
| CRÍTICO | < 80 % | Red |
Understanding CUMPL.MIN vs CUMPL.MAX
Both columns measure the same average vehicles against a required-vehicle baseline, but on different thresholds:
- CUMPL.MIN asks "Are we covering the off-peak floor?" — easier bar, higher percentage.
- CUMPL.MAX asks "Are we covering peak demand?" — harder bar, lower percentage.
Example: PROM.1H = 5, REQ.MIN = 3, REQ.MAX = 5
→ CUMPL.MIN = 167 % (well above floor) · CUMPL.MAX = 100 % (exactly meeting peak)
Bottom Analytics Panel
Cumplimiento por Sindicato (bar chart) — A vertical bar per union showing its average CUMPL.MIN across all its lines. Color follows green/amber/red thresholds.
Distribución de Estados — Horizontal bars showing what fraction of all lines are CUMPLE / ALERTA / CRÍTICO, labeled with count and percentage.
Infractores por Sindicato — Tiles showing off-route vehicle count per union. Red = at least one vehicle is outside all checkpoint radii.
Filters & Controls
| Control | Effect |
|---|---|
| Sindicato dropdown | Narrows the table to one union (ADMIN users are always auto-scoped to their own) |
| Estado dropdown | Shows only lines with the selected compliance status |
| Anterior / Siguiente | Paginate the table (10 rows per page) |
| Auto (10 min) checkbox | Toggles automatic refresh every 10 minutes |
| Actualizar button | Manual refresh |
Dashboard de Operaciones — Análisis Histórico
Route:
/dashboard-v1
Refresh: automatic every 30 minutes; also triggered by any filter change
This dashboard answers the question: "How has the fleet performed over a chosen date range?"
It aggregates completed trip records, passenger boardings, and driver activity into charts and KPIs for retrospective analysis.
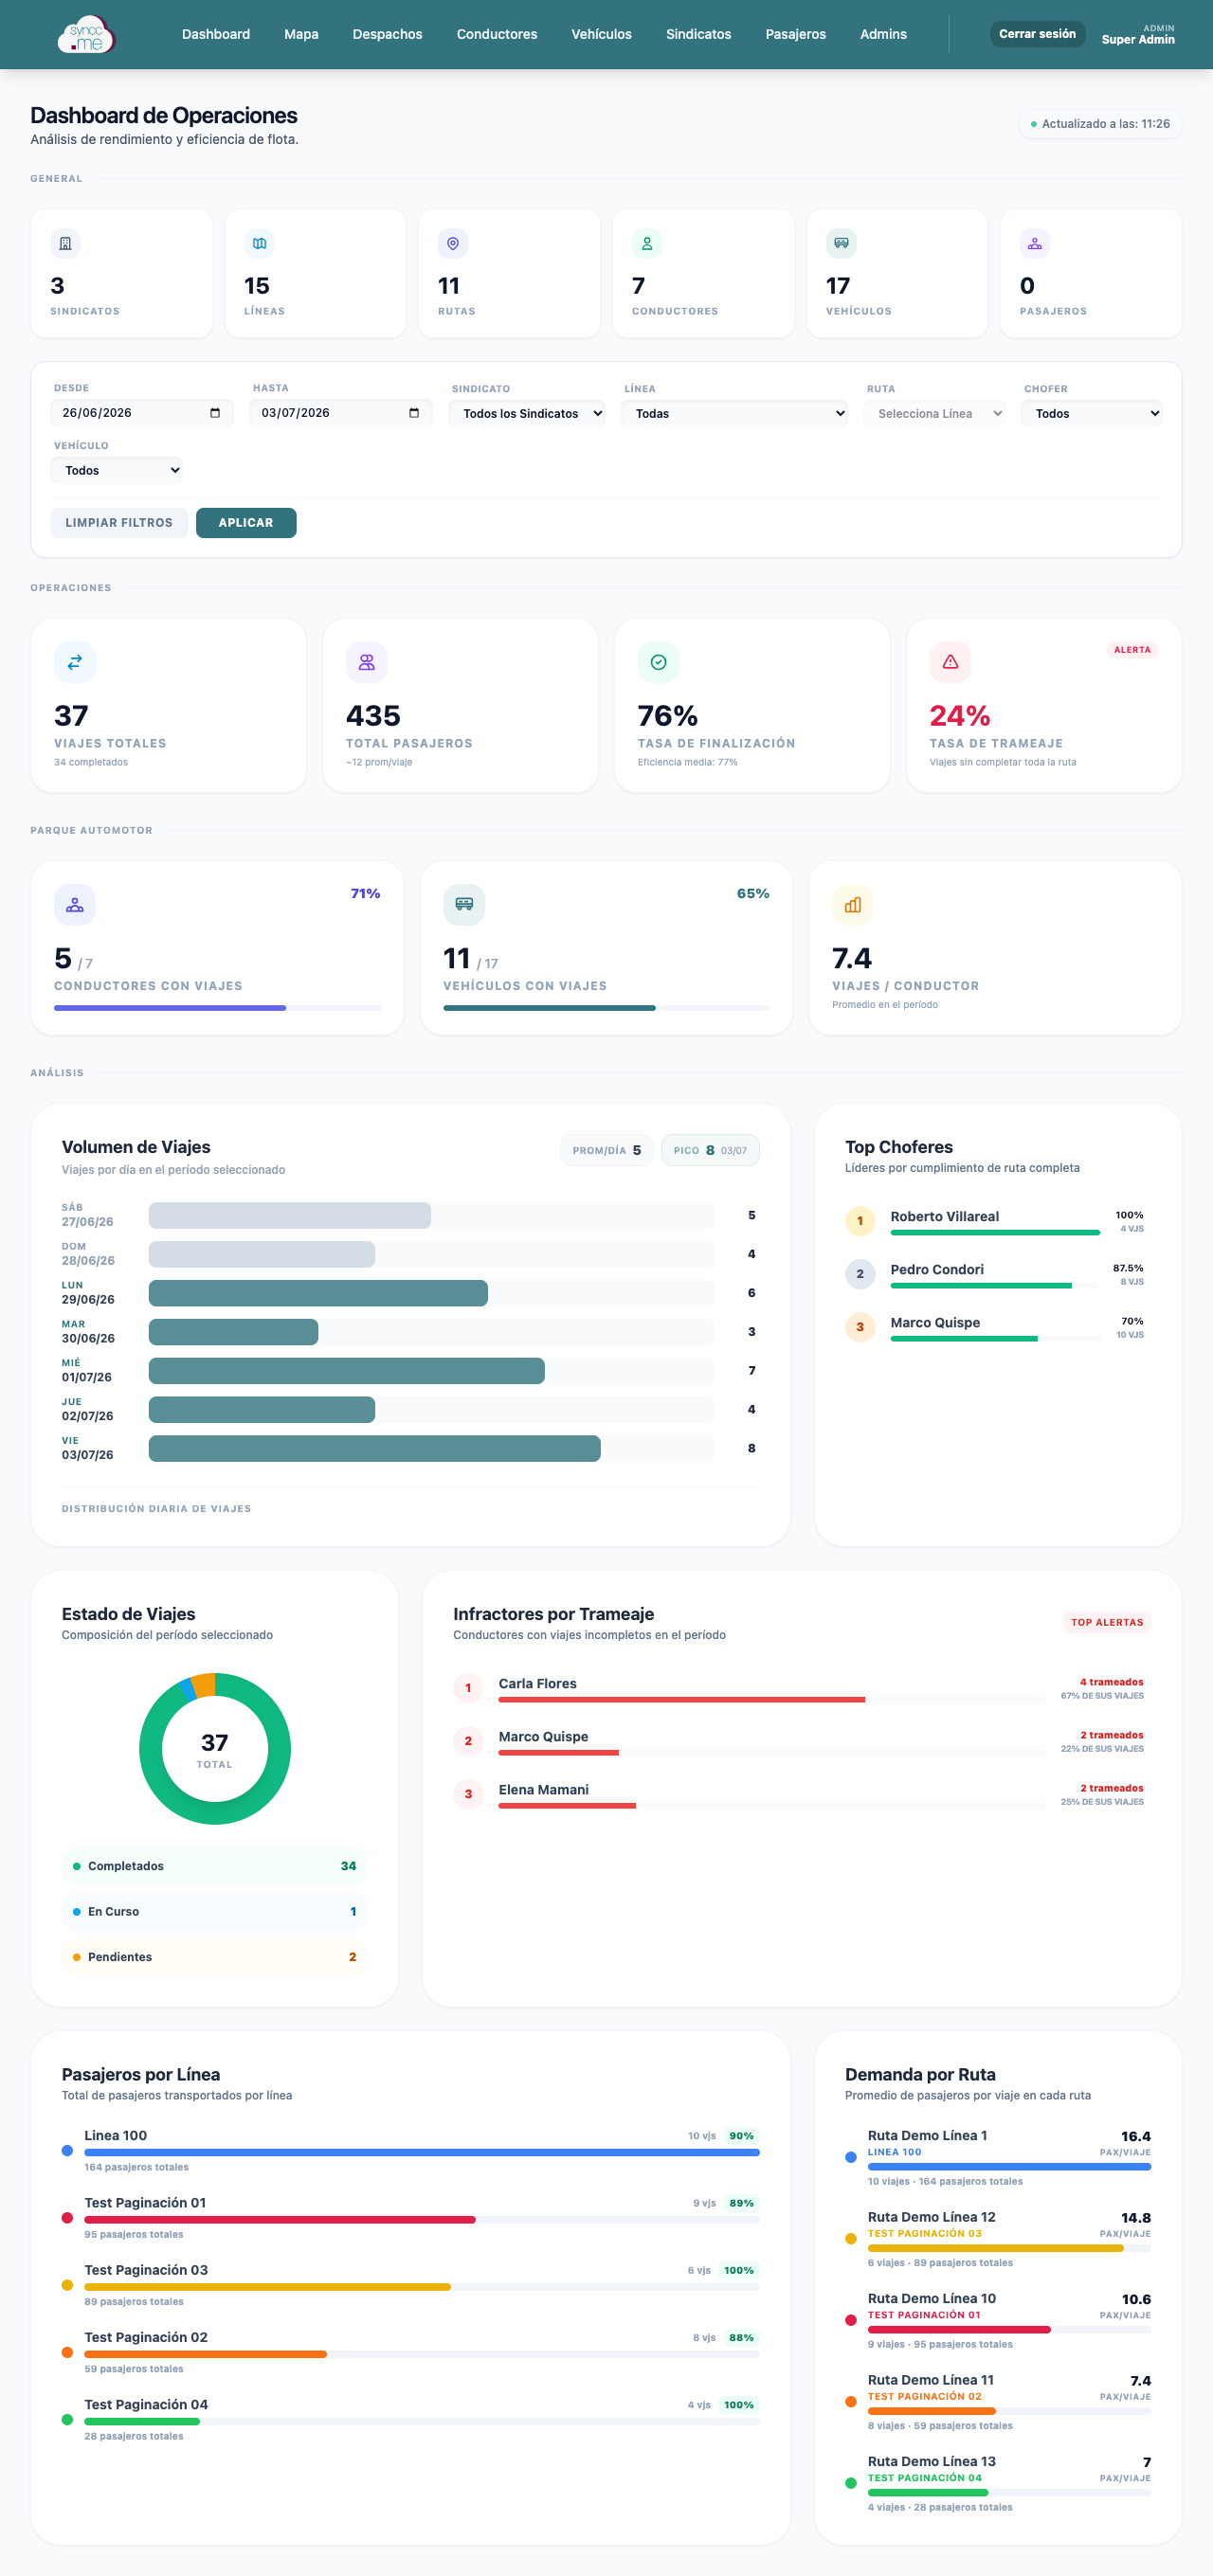
Filter Bar
All data on this dashboard is scoped by:
| Filter | Description |
|---|---|
| Desde / Hasta | Date range (defaults to last 7 days) |
| Sindicato | Union filter — visible to SUPER_ADMIN only; ADMIN users are auto-scoped |
| Línea | Specific route |
| Ruta | Specific route variant (enabled only when a Línea is selected) |
| Chofer | Individual driver |
| Vehículo | Individual vehicle by plate |
Changing any filter re-fetches all data immediately.
General Stats (top cards)
These are global registry counts, not filtered by date range — they reflect the current state of the system.
| Card | What it counts |
|---|---|
| Sindicatos | Total registered unions (SUPER_ADMIN view only) |
| Líneas | Total registered lines |
| Rutas | Total route variants across all lines |
| Conductores | Total registered drivers |
| Vehículos | Total registered vehicles |
| Pasajeros | Total registered passenger accounts |
Operaciones KPIs
| KPI | Meaning |
|---|---|
| Viajes Totales | Total trips created in the selected period, across all statuses |
| Total Pasajeros | Sum of passengers who boarded during the period (via QR check-in) |
| Tasa de Finalización | completed trips that reached all checkpoints / completed trips with checkpoints × 100. Measures how reliably drivers cover the full route. |
| Tasa de Trameaje | Percentage of completed trips where the driver did not clear all checkpoints (incomplete route). A non-zero rate triggers an Alerta badge. Finalización + Trameaje always sums to 100 %. |
Parque Automotor (Fleet Utilization)
| Card | Meaning |
|---|---|
| Conductores con Viajes | Drivers who had at least one trip in the period, shown as active / total registered. |
| Vehículos con Viajes | Vehicles that ran at least one trip, shown as active / total registered. |
| Viajes / Conductor | Average trips per active driver in the period. Useful for spotting workload imbalance. |
Charts
Volumen de Viajes (Daily Volume)
Horizontal bar chart — trips per calendar day. Weekdays are teal, weekends are grey. Two pills show average trips/day and the single peak-volume day.
Estado de Viajes (Donut)
Trip status breakdown for the period: - 🟢 Completados — trip reached the end of the route - 🔵 En Curso — trip is currently active - 🟡 Pendientes — trip scheduled but not yet started
Top Choferes
Drivers ranked by completion rate (fully-completed trips / their total trips). Gold/silver/bronze for top 3. Shows trip count and a green progress bar per driver.
Infractores por Trameaje
Drivers with the most incomplete trips, ranked by count and shown as a percentage of their total completed trips. An empty state means no incidents.
Pasajeros por Línea
Horizontal bars scaled to the highest-passenger line. Shows total passengers, total trips, and a completion-rate badge (green ≥ 80 %, amber 50–79 %, red < 50 %) per line.
Demanda por Ruta
Average passengers per trip for each route variant — shows which routes are underserved (low pax/trip) or most in demand. Sub-label shows total trips and total passengers.
Which Dashboard to Use
| Question | Dashboard |
|---|---|
| Is Route X running enough buses right now? | Tablero de Control |
| Which routes are critically under-staffed this morning? | Tablero de Control → CRÍTICO filter |
| How many buses does Route X need at 10 AM? | Tablero de Control → Rango Horario 10:00–14:00 |
| How many trips did we complete last week? | Dashboard de Operaciones |
| Which driver has the worst trameaje rate? | Dashboard de Operaciones → Infractores |
| Which line moved the most passengers this month? | Dashboard de Operaciones → Pasajeros por Línea |
| How busy is peak hour vs. off-peak? | Dashboard de Operaciones → Volumen de Viajes |